Q3 2025 Market Review
AI Excitement and Fed Cuts Spur Strong Stock Returns in 3rd Quarter
Stocks posted strong returns for the third quarter as the Russell 3000 Index gained 8.18%. The Federal Reserve made its first rate cut ofthe year at its September meeting and signaled openness to further rate cuts before the end of 2025. While the quarter ended with the US headed towards a government shutdown, the market gained even going into the end of the quarter, with major US stock indices posting positive returns for each month during the third quarter.
Technology stocks outpaced other sectors during the quarter as continued excitement around artificial intelligence (AI) drove stocks like NVIDIA to reach new all- time highs. The NASDAQ Composite Index returned 11.41% for the quarter. While technology’s dominance has been a trend over the course of this year, the third quarter also saw strong returns for small cap stocks, which had lagged earlier this year. The Russell 2000 Index was up 12.39% for the third quarter, outpacing large cap stocks.
While globally stocks were up, US gains outpaced other developed markets with the MSCI World ex USA IMI Index (net dividends) returning 5.60% for the quarter. Emerging markets outpaced developed stocks as the MSCI Emerging Markets IMI Index (net dividends) rose 9.88%. Despite this quarter, non-US markets overall are outpacing the US market’s gains year-to-date with the MSCI All Country World ex USA IMI Index (net dividends) up 25.97% year-to-date while the Russell 3000 Index is up 14.40%.
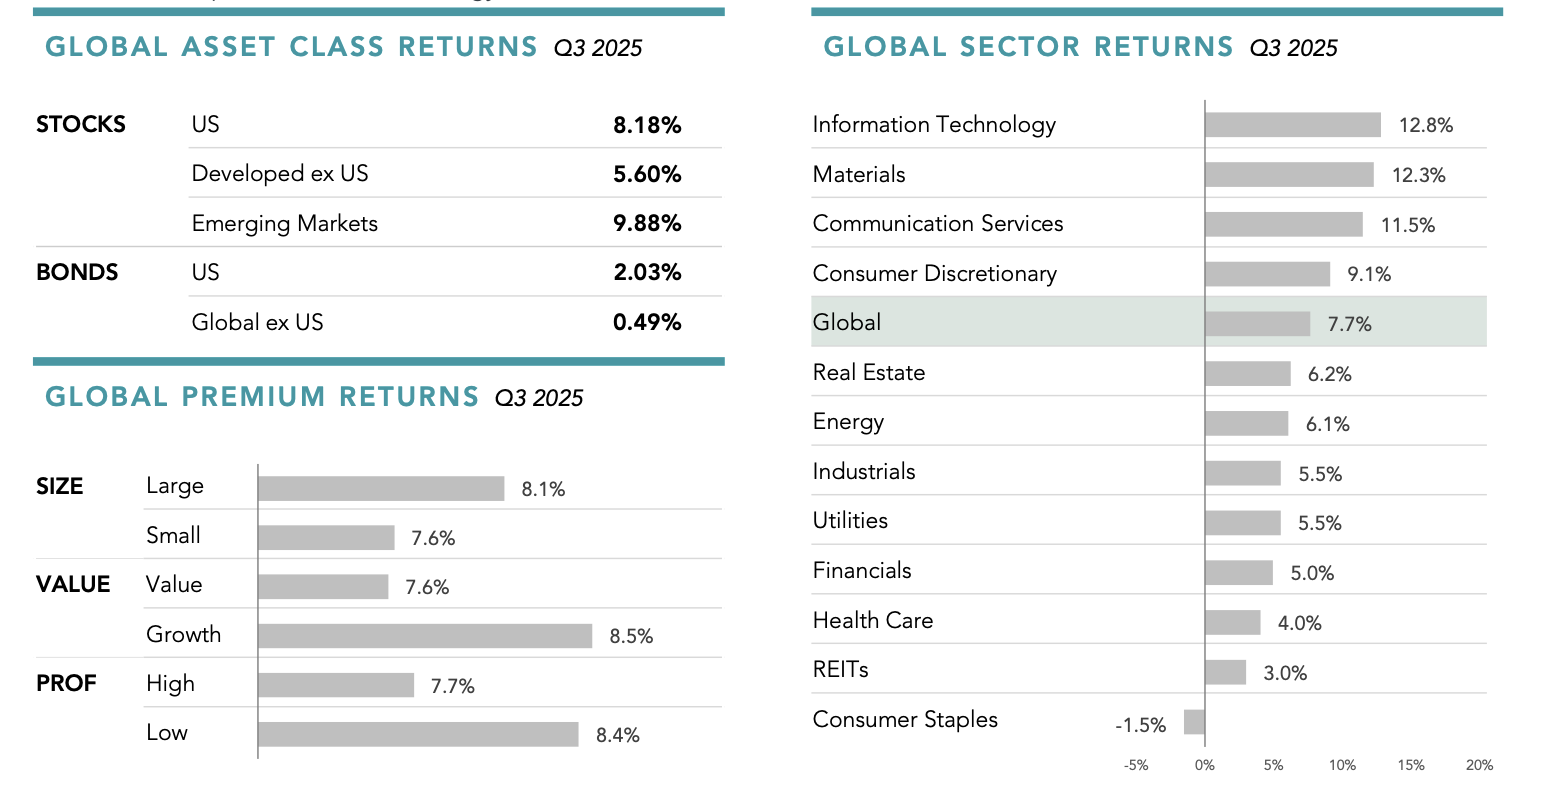
Past performance is no guarantee of future results. Pacific Capital Works is an investment advisor registered with the Securities and Exchange Commission. Diversification does not eliminate the risk of market loss. Risks include loss of principal and fluctuating value. Investment value will fluctuate, and shares, when redeemed, may be worth more or less than original cost. Premium refers to a return difference between two assets or portfolios. Market segment (index representation) as follows: US Stock Market(Russell 3000 Index), Developed ex US Stocks (MSCI World ex USA IMI Index [net div.]), Emerging Markets (MSCI Emerging Markets IMI Index [net div.]), US Bond Market (Bloomberg US Aggregate Bond Index), and Global Bond Market ex US (Bloomberg Global Aggregate ex-USD Bond Index [hedged to USD]), Global Stock Market (MSCI All Country World IMI Index [net div.]). Sector returns are derived by Dimensional using constituent data from the MSCI All Country World IMI Index. Returns for specific securities are sourced from the MSCI All Country World IMI Index using daily security returns. Securities without a GICS sector are excluded. Sectors are classified according to GICS Industry code. GICS was developed by and is the exclusive property of MSCI and S&P Dow Jones Indices LLC, a division of S&P Global. S&P data © 2025 S&P Dow Jones Indices LLC, a division of S&P Global. All rights reserved. © 2025. Nasdaq, Inc. All Rights Reserved.Frank Russell Company is the source and owner of the trademarks, service marks, and copyrights related to the Russell Indexes. MSCI data © MSCI 2025, all rights reserved. Bloomberg data provided by Bloomberg. Indices are not available for direct investment. Index performance does not reflect the expenses associated with the management of an actual portfolio. Global Premium Returns are computed from MSCI All Country World IMI Index published security weights and Dimensional computed security returns and Dimensional classification of securities based on size, value, and profitability parameters. Within the US, Large Cap is defined as approximately the largest 90% of market capitalization in each country or region; Small Cap is approximately the smallest 10%. Within the non-US developed markets, Large Cap is defined asapproximately the largest 87.5% of market capitalization in each country or region; Small Cap is approximately the smallest 12.5%. Within emerging markets, Large Cap is defined as approximately the largest 85% of market capitalization in each country or region; Small Cap is approximately the smallest 15%. Designations between value and growth are based on price-to-book ratios. Value is defined as the50% of market cap with the lowest price-to-book ratios by size category and growth is the highest 50%.Profitability is measured as operating income before depreciation and amortization minus interest expense scaled by book. High profitability is defined as the 50% of market cap with the highest profitability by sizecategory and low profitability is the lowest 50%. REITs and utilities, identified by GICS code, and stocks without size, relative price, or profitability metrics are excluded from this analysis. Countries not in theDimensional investable universe are excluded from the analysis. This information is intended for educational purposes and should not be considered a recommendation to buy or sell a particular security. Named securities may be held in accounts managed by Pacific Capital Works. References to specific company securities should not be construed as a recommendation or investment advice.
Review the Full Market Report